Deploy ELK stack in Kubernetes
Deploy ELK Stack on Kubernetes
Introduction
The ELK (Elasticsearch, Logstash, Kibana) stack is a powerful open-source solution for log management, analysis, and visualization. The latest version ushers in new geospatial analysis and uptime monitoring capabilities. Additionally, cross-cluster replication, index lifecycle management, Function beat, Elasticsearch SQL, the Logs UI, and the Infrastructure UI are now generally available.
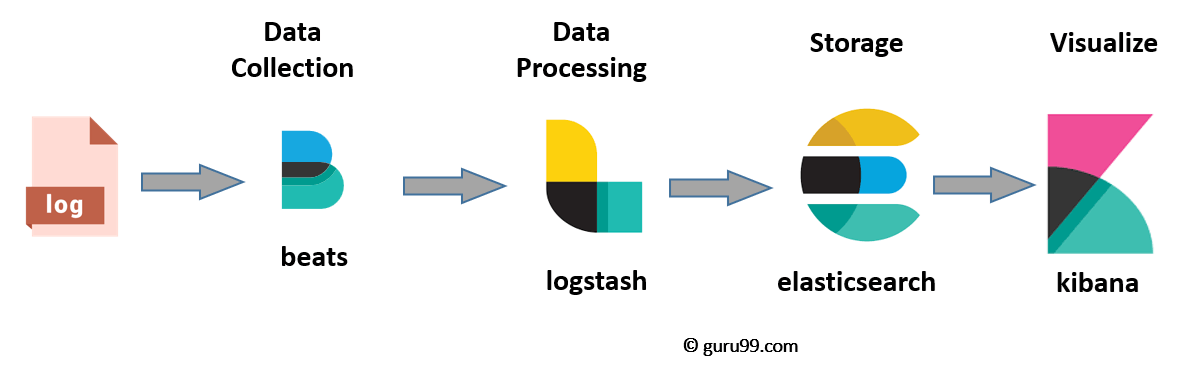
The ELK stack consists of three main components:
1. Elasticsearch: A distributed, highly scalable search and analytics engine that stores and indexes data.
2. Logstash: A data processing pipeline that collects, transforms, and sends logs and other data to Elasticsearch.
3. Filebeat: Setup services to farm all the logs from all our nodes
4. Kibana: A web-based interface for visualizing and exploring data stored in Elasticsearch. It provides powerful search and filtering capabilities, along with interactive dashboards and visualizations.
When configured together, the ELK stack enables organizations to centralize log data, gain insights into application performance and security, and troubleshoot issues effectively.
Note: Modify ELK Configuration Values
Please modify the configuration values according to your specific requirements. This includes adjusting CPU and RAM limits, volume sizes, and any other parameters relevant to your environment.
Prerequisites
Before we dive into the setup process, make sure you have the following prerequisites in place:
- A Kubernetes cluster up and running.
- kubectl, the Kubernetes command-line tool, installed and configured.
- Helm, the package manager for Kubernetes, installed.
- You should add helm repo with command: helm repo add elastic https://helm.elastic.co
Step 0: Clone the Git Repository and Navigate Into It
>$ cd elk-in-kubernetes-with-tls
Step 1: Set Up Elasticsearch
namespace/elk created
>$ helm upgrade --install elasticsearch elastic/elasticsearch --version=8.5.1 -f ./elasticsearch/values.yaml --namespace elk
...
Step 2: Set Up Logstash
Logstash essentially acts as a single place that receives all our logs, analyses and processes them into a format Elasticsearch can understand and then forwards this to our Elasticsearch cluster.
>$ helm upgrade --install logstash elastic/logstash --version=8.5.1 -f ./logstash/values.yaml --namespace elk...
Step 3: Set Up Kibana
By now the system is collecting all the logs from all the services as well as from the nodes themselves, having Logstash analyse them and then sending them on to Elasticsearch to be indexed. However we still can’t visualise them, this is where Kibana comes in. This one is very simple, we setup a Kibana instance based on elastics docker image and point it towards our internal Elasticsearch cluster, we then setup a service so it can be recognised by an ingress, and then setup the ingress so it can be accessed from your browser.
>$ helm upgrade --install kibana elastic/kibana --version=8.5.1 -f ./kibana/values.yaml --namespace elk...
Step 4: Deploy Filebeat
Filebeat is a lightweight shipper that enables you to send your Kubernetes logs to Logstash and Elasticsearch. Configure Filebeat using the pre-defined examples below to start sending and analysing your Kubernetes logs.
>$ helm upgrade --install filebeat elastic/filebeat --version=7.17.3 -f ./filebeat/values.yaml --namespace elkStep 5: Verify Log Ingestion
To verify that logs are being ingested into your ELK stack, follow these steps:
1. Access the Kibana UI using the configured domain or IP address with https://.
2. Log in to Kibana with your credentials.
3. Navigate to the Logs section in Kibana.
4. Configure the log indices and filters as needed to view the logs.
5. Verify that logs from your applications are visible in Kibana.
Conclusion
Congratulations! You have successfully set up an ELK stack with TLS and Filebeat 7 in your Kubernetes environment. TLS ensures secure communication between the ELK components, while Filebeat enables the collection and forwarding of logs from your applications. You can now leverage the power of Elasticsearch, Logstash, Kibana, and Filebeat to manage and analyze logs effectively. Remember to monitor and maintain the health of your ELK stack and periodically update to the latest stable versions of the software components.
Bonus: Parsing PHP-FPM Logs with Logstash
As a bonus, I have included a sample Logstash configuration to parse PHP-FPM logs.You can find this in values.yaml of logstash folder. This can help you extract meaningful information from your PHP application logs and make them more structured and searchable in Elasticsearch.
If you Liked my blog , You can Follow me on LinkedIn: https://www.linkedin.com/in/sushmita-rimal-7a5a2b272/
People who read this also read
Transitioning into DevOps: A Journey from Network and System Background